Fishbone Diagram
What is it?
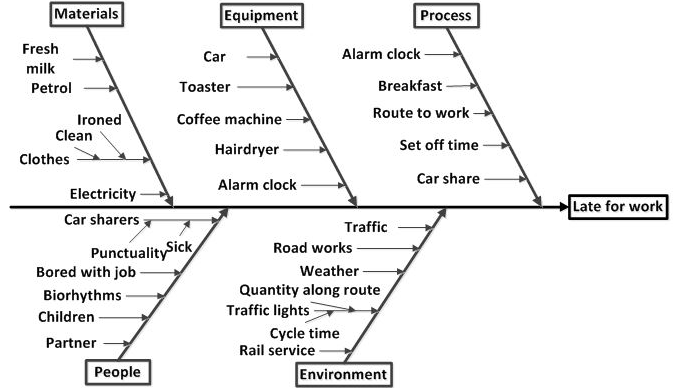
A fishbone diagram is a way of visualising the causes of a problem. A fishbone diagram helps you to understand your system before you change it. It helps to prioritise some of the areas where the biggest impact could be made.
It can also be called a ‘cause and effect diagram’ or an Ishikawa diagram.
Why use it?
We often think we know what causes a problem but on deeper investigation it is rarely a single cause. It is important to understand your system before you start changing it. Fishbone diagrams are often used when investigating a significant adverse event but are also useful when looking at a quality improvement problem.
How to use it?
Get together the people who experience the problem on a regular basis. These are your experts.
Start with your problem written on one side of the page. On post-it notes, write down the possible reasons for your problem. Try to make these as specific as possible (e.g. ‘my brother does not reply to text messages’ as opposed to ‘poor communication’).
Once you have a number of specific reasons, look over them all and group together those of a similar theme (e.g. people, equipment, environment, communication) and place these in a similar space on the page. There may be smaller subheadings within these groups, if so, keep them together.
Label these headings and subheadings. This will allow you to look at the broad themes as well as the specific causes for your problem.
Click here for an example of how to create a fishbone diagram.
Example Fishbone diagrams
Click on the pics below to view them fullscreen.
More information
Quality Improvement Zone NES - for further information and templates
IHI - for further information
NHS Improvement - for templates and further reading

